Best Tools for Prop Trading Analytics

Want to succeed in prop trading? Analytics tools are your secret weapon. They help you stick to strict rules, track performance, and manage risk - essentials for passing evaluations and scaling accounts.
Here’s what you need:
- Trade Journaling: Tools like TradeZella and Tradervue track win rates, drawdowns, and risk-reward ratios.
- Risk Management: Real-time metrics and alerts prevent costly mistakes.
- Visualization: Platforms like TradingView simplify data with charts and dashboards.
- Custom Spreadsheets: A free, flexible option for tracking trades manually.
Quick Picks:
- TradersYard: Built-in analytics for U.S. traders, funding up to $500K, and a 95% profit split.
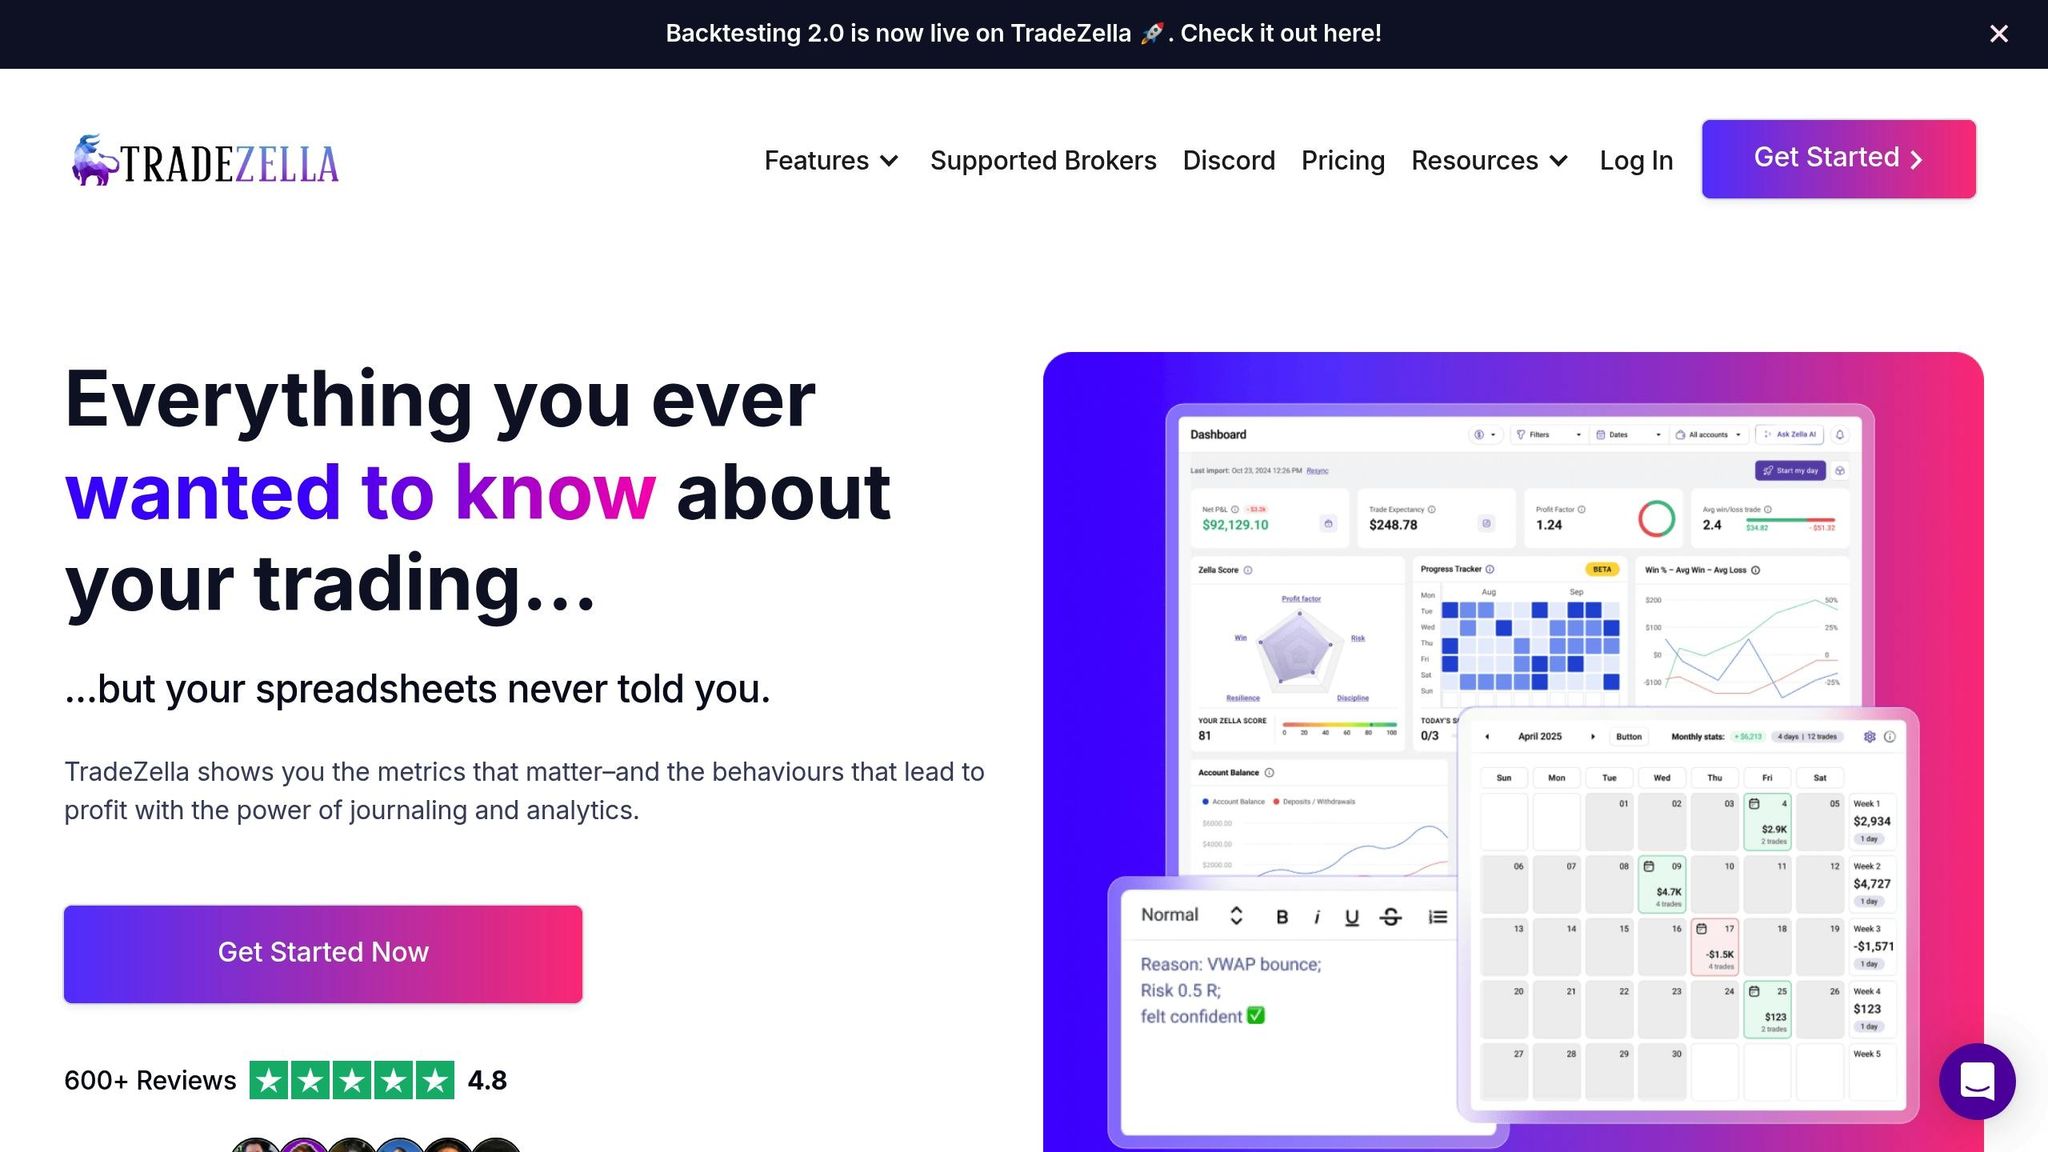
- TradeZella: Behavioral insights and trade replay for $19/month.
- TradingView Pro: Advanced charting at $12.95/month.
These tools help you stay disciplined and meet prop firm standards. The choice depends on your budget and trading style.
How to properly track all your prop firm accounts with Tradezella !!
What to Look for in Prop Trading Analytics Tools
Selecting the right analytics tool can be a game-changer for your prop trading journey. Whether you're aiming for a funded account or trying to pass an evaluation, having access to the right data can make all the difference. Here's what separates professional-grade analytics tools from basic charting software.
Trade Journaling and Performance Tracking
Keeping a trade journal is a cornerstone of successful prop trading. Documenting each trade’s entry, exit, reasoning, and outcome helps you identify patterns that aren’t immediately obvious in profit and loss reports. For instance, you might uncover trends like consistent losses on Fridays or strong performance during market openings. These insights are especially valuable when every trade counts during a prop firm evaluation.
Your analytics tool should track key performance metrics in USD currency with formats that align with U.S. standards. Metrics such as win rate, average risk-reward ratio, maximum drawdown, and risk-adjusted returns (like Sharpe or Sortino ratios) are essential. Tools like TradeZella and Tradervue are excellent in this area, offering detailed performance analytics tailored for American traders. Pricing starts at $19 and $29 per month, respectively.
Automated journaling features can categorize trades by strategy, time, and market conditions. This automation not only saves time but ensures no trade goes undocumented. For traders managing larger accounts, these insights become critical for refining strategies and maintaining disciplined risk management.
Risk Management and Real-Time Metrics
In prop trading, real-time risk management is non-negotiable - it’s what keeps you in the game. For instance, platforms like TradersYard enforce strict rules such as a 5% daily loss limit and a 10% maximum drawdown for CFD accounts. Violating these rules results in immediate disqualification, even if your overall profitability is strong.
A reliable analytics tool should include position sizing calculators that adjust based on your account balance and risk tolerance. For example, if you’re trading a $100,000 account and risk 2% per trade, the tool should calculate variable position sizes automatically, taking your stop loss into account. This eliminates guesswork and ensures precise risk management.
Automated alerts are another must-have feature. Set up notifications to warn you when you’re nearing your daily loss limit or when your account drawdown reaches a critical threshold. This is especially important for platforms like TradersYard, where the static drawdown rule keeps your maximum loss limit fixed at your starting balance.
Additionally, risk-reward analysis tools allow you to evaluate trades before committing. By inputting your entry price, stop loss, and target, the tool can instantly determine if a trade meets your minimum risk-reward criteria. This feature helps prevent emotional decision-making, particularly in volatile markets.
Data Visualization and Reporting
While tracking data is important, the ability to visualize it effectively can provide a deeper understanding of your strategies.
Clear dashboards and intuitive charts are essential for turning raw data into actionable insights. Look for tools that display data in formats familiar to U.S. traders, such as MM/DD/YYYY for dates, 12-hour time formats, and USD currency symbols. This consistency helps avoid confusion during fast-paced decision-making.
For advanced charting capabilities, TradingView Pro is a popular choice among U.S. traders, with pricing starting at $12.95 per month. Its customizable dashboards allow you to monitor multiple timeframes and markets simultaneously. Plus, real-time alerts ensure you’re updated on key price movements, even when you’re away from your screen.
Interactive performance charts can highlight your equity curve over time, showing periods of strong performance alongside drawdown phases. Heat maps, on the other hand, can reveal which trading sessions or days of the week yield the best results. These visual tools make it easier to identify trends that might otherwise be buried in spreadsheets.
Robust reporting features are equally important, especially for tax preparation and performance reviews. Your tool should generate detailed reports that break down your trading activity by month, strategy, and instrument. Export options in formats like PDF and CSV ensure compatibility with accounting software and tax tools commonly used in the U.S.
Some visualization tools also offer trade replay features, allowing you to review past trades in the context of market conditions. This can help you assess whether your entries and exits were well-timed or if better opportunities were missed due to hesitation or poor timing. These insights are invaluable for improving your decision-making over time.
Best Prop Trading Analytics Tools
Here’s a look at some of the top tools for prop trading analytics. These platforms cater to a variety of trading needs and budgets, seamlessly integrating with the analytics features discussed earlier.
TradersYard
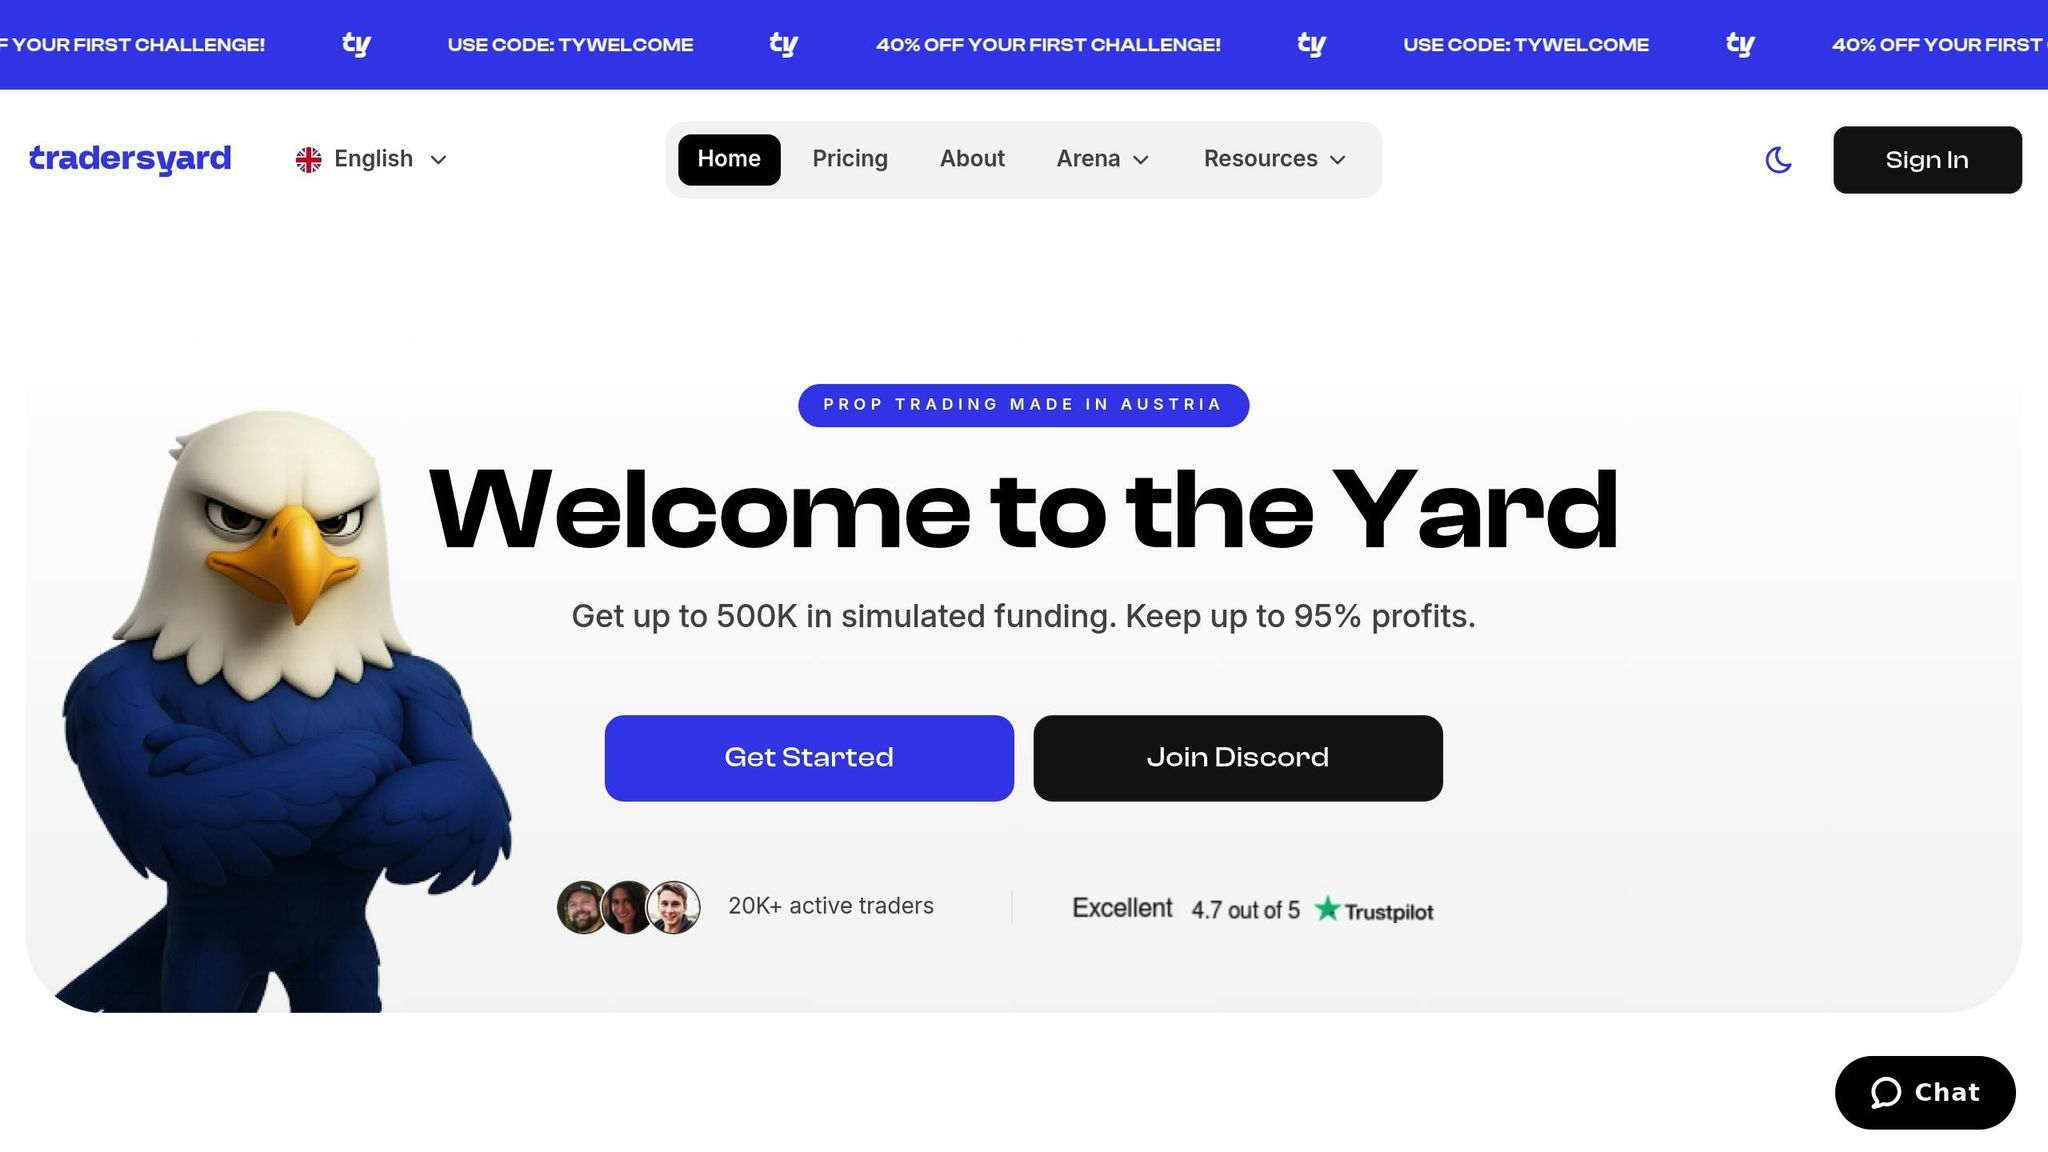
TradersYard is a robust prop trading platform that combines analytics with a rigorous evaluation process. It offers simulated funding with competitive profit splits of up to 95%, exclusively available to U.S. traders.
What makes TradersYard stand out is its in-depth trade statistics tracking. It monitors key metrics like win rates, profit factors, and consistency across multiple sessions. The no trailing drawdown policy ensures that your maximum loss limit stays fixed at your starting balance, making performance tracking straightforward. For risk management, the platform supports CFD accounts with clear rules: a 5% daily loss limit and a 10% maximum drawdown, all monitored in real time to provide immediate feedback on risk exposure. Plus, with payouts processed in under 4 hours, accessing your profits is quick and hassle-free.
TradersYard also offers scaling programs that let traders grow their account sizes based on performance, with a progression path leading up to $500,000 in funding.
TradingView

TradingView is a go-to platform for charting and technical analysis, widely favored by U.S. prop traders. The Pro plan, starting at $12.95 per month, includes advanced charting tools, while the Pro+ plan at $24.95 per month adds multiple chart layouts and enhanced alert capabilities for managing more complex strategies.
Real-time alerts are a key feature, allowing traders to set notifications for important price levels without constantly monitoring charts. Customizable indicators and multi-timeframe analysis make it easy to fine-tune strategies. Additionally, TradingView supports U.S. trading formats, including MM/DD/YYYY date formatting and 12-hour time displays. For those who want to create custom indicators, the platform’s Pine Script offers the flexibility to design tailored analytics tools.
TradeZella
TradeZella is a specialized tool for trade journaling and behavioral analytics, designed to help traders uncover performance patterns. The Starter plan, priced at $19 per month, includes essential journaling features that go beyond basic trade logging.
TradeZella provides insights into behavioral tendencies, such as recurring losses on specific days, that might otherwise go unnoticed. For advanced features, the Pro plan at $39 per month offers trade replay functionality, allowing users to review past trades in the context of market conditions at the time. The platform also simplifies trade imports, automatically categorizing them by strategy, time, and market conditions. Detailed performance reports break down trading activity by month, strategy, and instrument, offering a comprehensive view of your trading behavior.
Tradervue
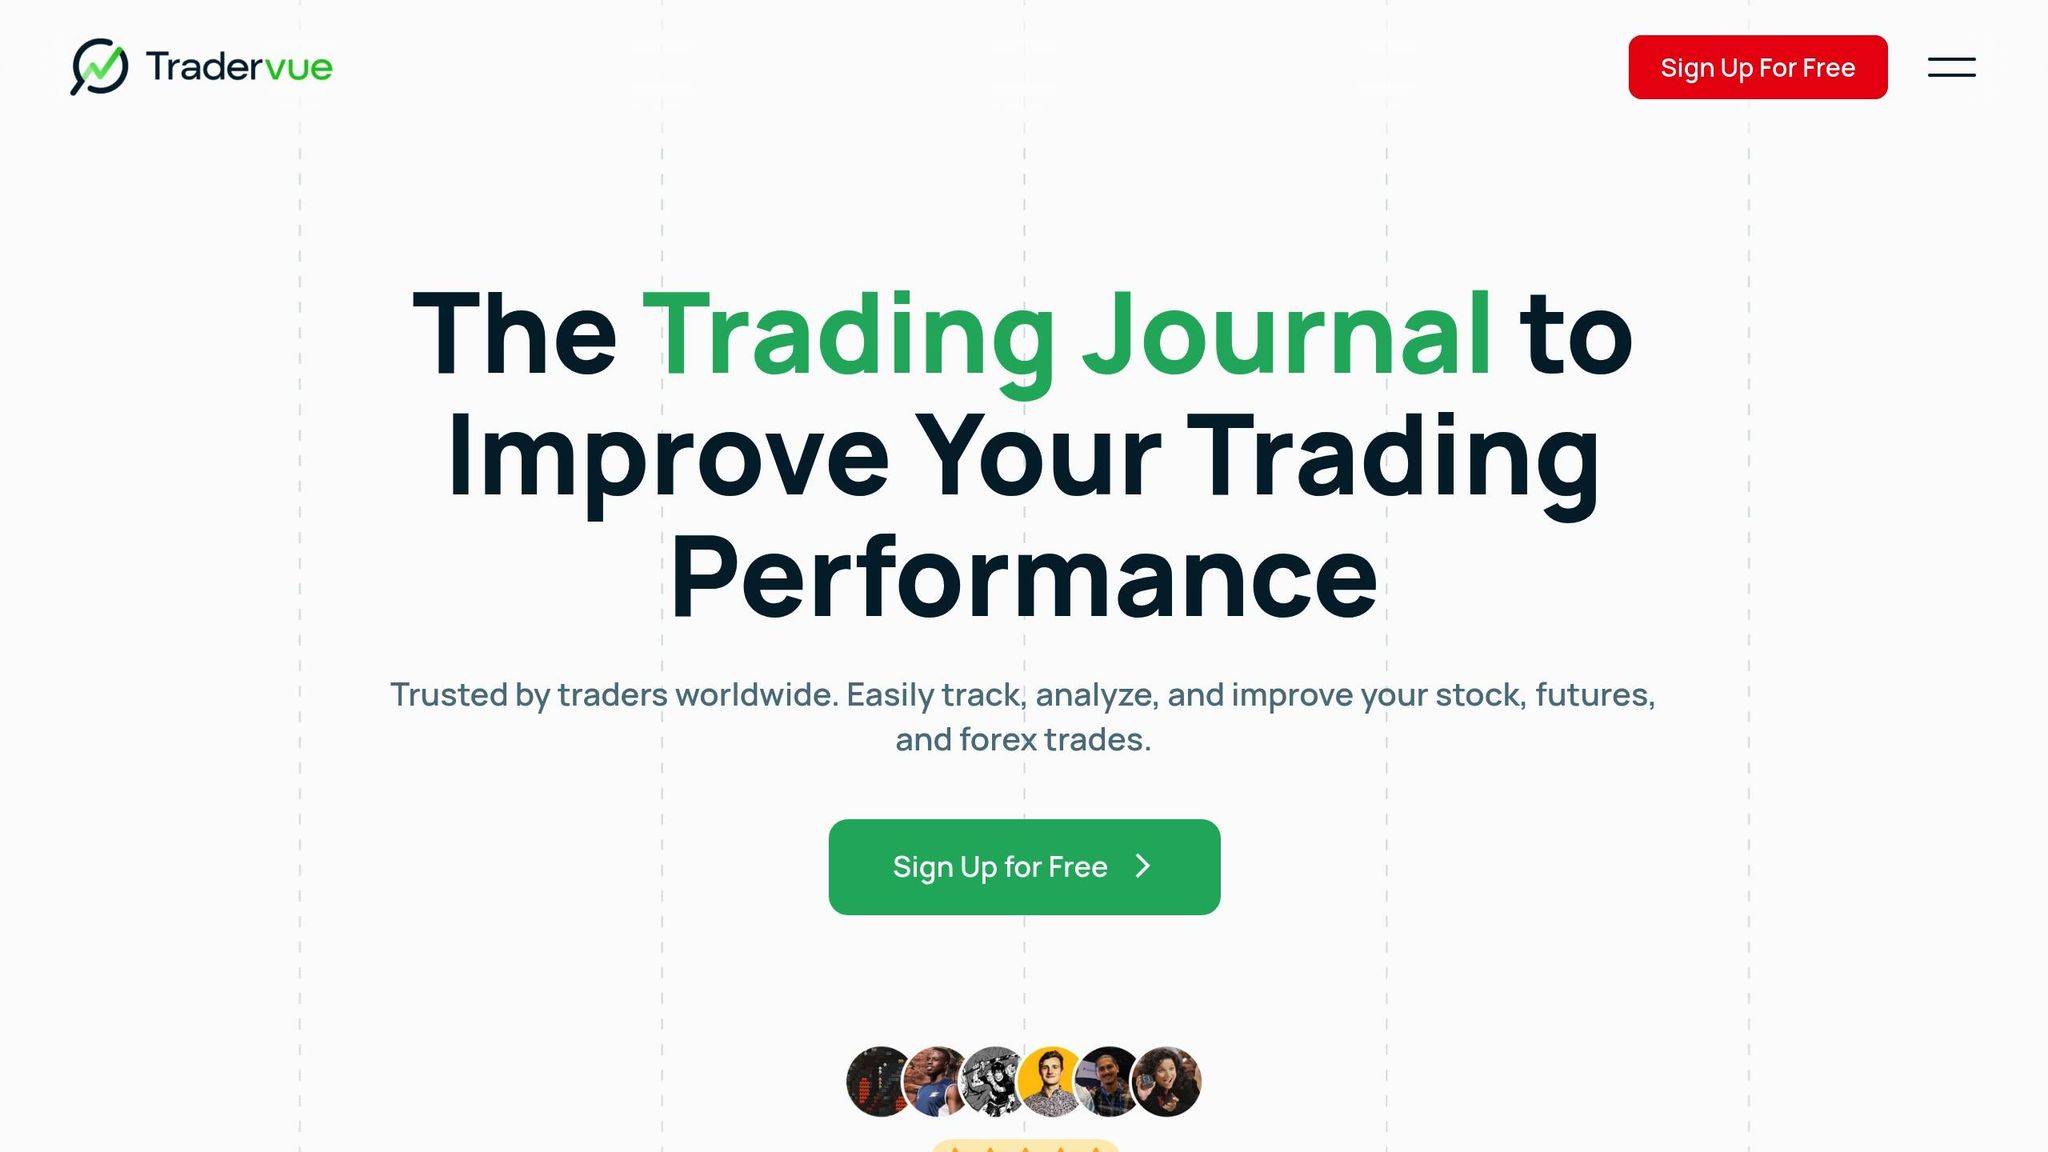
Tradervue is ideal for traders who need multi-broker journaling capabilities. At $29 per month, it consolidates data from various sources into one unified platform.
The platform excels in generating detailed performance metrics, including Sharpe ratios, profit factors, and risk-adjusted returns. It also integrates seamlessly with U.S. accounting and tax tools, making it easier to manage financial reporting. Tradervue’s interactive charts display equity curves, while heat maps highlight the most profitable trading sessions, offering valuable insights to refine your trading schedule.
Custom Spreadsheet Solutions
For those who prefer full control, custom spreadsheets in Excel or Google Sheets provide unmatched flexibility with no monthly cost, making them a great option for budget-conscious traders.
To meet the needs of U.S.-based traders, these spreadsheets should use USD currency formatting, MM/DD/YYYY date formats, and standard decimal conventions (periods for decimals, commas for thousands). Key columns might track details like entry price, exit price, position size, profit/loss in dollars, win/loss status, and trade duration.
Automated calculations can help monitor metrics such as win rates, average win/loss sizes, profit factors, and risk-adjusted returns. Conditional formatting is particularly useful for highlighting losing days or streaks of consecutive losses, allowing traders to quickly spot behavioral patterns.
The biggest advantage of custom spreadsheets is their adaptability. You can tailor them to account for specific prop firm rules, such as daily loss limits or maximum drawdown calculations, and even include notes on market conditions or your emotional state during trades. While they lack the advanced features of dedicated platforms, spreadsheets offer the hands-on control and customization many traders value, especially during the evaluation phase. Accurate performance tracking, whether through a platform or a spreadsheet, is key to success in prop trading.
sbb-itb-1dce033
Tool Comparison Table
When it comes to prop trading, having the right tools can make all the difference. With precise analytics, you can maintain strict risk management and track performance effectively. To help you choose the best fit for your needs and budget, here's a breakdown of essential tools, their features, pricing, and capabilities.
ToolMonthly Cost (USD)Key FeaturesAccount TypesIntegrationBest ForTradersYardIncluded in the challenge feeReal-time risk monitoring, trade statistics, scaling programs, no trailing drawdownCFD accounts up to $500,000Proprietary platformU.S. traders looking for built-in analytics and prop trading toolsTradingView Pro$12.95Advanced charting, real-time alerts, custom indicatorsAll major asset classesOver 100 brokers, API accessTraders focused on technical analysis and backup chartingTradingView Pro+$24.95Multiple chart layouts, enhanced alerts, Pine ScriptAll major asset classesOver 100 brokers, advanced APIProfessional traders needing advanced setupsTradeZella Starter$19.00Basic journaling, behavioral analytics, trade categorizationStocks, options, futuresInteractive Brokers, Thinkorswim, MT4/MT5Beginner to intermediate tradersTradeZella Pro$39.00Trade replay, mentor sharing, advanced reportsStocks, options, futuresInteractive Brokers, Thinkorswim, MT4/MT5Traders seeking in-depth performance analysisTradervue$29.00Multi-broker journaling, Sharpe ratios, tax integrationStocks, options, futures, forexMultiple U.S. brokers, tax softwareTraders managing multiple accountsCustom Spreadsheets$0.00Full customization, unlimited metrics, offline accessAny (manual setup)Manual input or custom integrationsBudget-conscious traders with Excel expertise
Comparison Table Details
Each tool on this list caters to different trading styles and priorities. For instance, TradingView's Pro plan ($12.95/month) offers advanced charting and real-time alerts, making it a go-to for traders who rely on technical analysis. For those needing more complex setups, the Pro+ plan ($24.95/month) includes multiple chart layouts and Pine Script for custom indicators.
TradeZella provides a solid journaling solution for traders serious about improving their performance. The Starter plan ($19/month) covers essentials like behavioral analytics and trade categorization, while the Pro plan ($39/month) adds valuable features like trade replay and mentor sharing, which are particularly helpful for reviewing past trades in detail.
Meanwhile, Tradervue is ideal for traders managing multiple accounts, thanks to its multi-broker journaling and integration with U.S. tax software. At $29/month, it simplifies year-end reporting for U.S.-based traders.
For those on a tight budget, custom spreadsheets offer unmatched flexibility at no cost. However, they require manual setup and ongoing maintenance, making them better suited for traders with Excel skills and the time to manage their data.
Key Insights for U.S. Traders
Several tools are tailored for U.S.-based traders. TradersYard focuses on CFD accounts with USD-based payouts, while TradingView supports U.S. market hours and native date formatting (MM/DD/YYYY). Tradervue's integration with tax software makes it a practical choice for simplifying year-end filings.
Balancing Cost and Functionality
Budget plays a significant role in selecting the right tools. A combination of TradingView's free tier and custom spreadsheets offers a no-cost solution for basic needs. On the other hand, a more robust setup with multiple platforms can cost between $30 and $50 per month. This range tends to strike the right balance between functionality and cost for most successful prop traders.
Understanding the strengths and limitations of each tool is crucial to avoid common pitfalls and make the most of your prop trading analytics setup.
Common Mistakes with Prop Trading Analytics Tools
Frequent Mistakes
Inconsistent Journaling
Many traders start off strong, recording every trade in detail, but over time, they skip entries. This inconsistency creates gaps in data that can hide important trends. For instance, a trader might miss noticing that their largest losses occur after two consecutive wins - a classic sign of overconfidence. Without complete records, identifying and addressing such patterns becomes almost impossible.
Overcomplicating Toolsets
Adding too many scanners or indicators, especially during evaluations, often backfires. When traders introduce unfamiliar tools, they can become hesitant or second-guess trades they would typically execute with confidence. This hesitation can lead to missed opportunities or even failed evaluations.
Ignoring Platform-Provided Analytics
Many traders rely on manual processes for managing risk, overlooking automated features like position limiters, P&L trackers, and daily loss alerts. Ignoring these built-in tools increases the chance of manual errors, which could otherwise be avoided.
Over-Investing in Unnecessary Analytics
There’s a misconception that more data leads to better trading results. Some traders spend heavily on advanced analytics, thinking it will give them an edge. However, success in prop trading often comes down to consistency and discipline, not complexity. Overloading on data can lead to analysis paralysis and cause traders to deviate from their proven strategies.
Lack of a Backup Plan
Relying solely on one platform without any contingency plan can be a recipe for disaster. A system crash or internet outage without backup charting tools or a manual trade closure process can expose traders to unnecessary risks.
Avoiding these common pitfalls is crucial for better risk management and consistent performance.
Best Practices
To sidestep these mistakes, integrate these disciplined habits into your routine:
Conduct Regular Performance Reviews
Dedicate time each week to review your analytics and trade journal. Look for trends in metrics like win rates, risk-to-reward ratios, and drawdowns. This proactive approach helps you make informed, data-backed adjustments instead of reacting emotionally.
Maintain Consistent Journaling
Stick to a single, reliable journaling format, whether it’s through tools like TradeZella or Tradervue. Record every trade immediately, including your reasoning, exit plan, and emotional state. A detailed journal can reveal recurring errors and highlight strategies that work.
Leverage Built-In Risk Management Features
Fully utilize the risk management tools available on your trading platform. Features like daily loss limits, position size calculators, and real-time P&L tracking can minimize human error and ensure compliance with prop firm guidelines.
Use Consistent U.S. Formats
Standardize all your reporting using U.S. conventions. This makes it easier to analyze your performance and simplifies tax reporting at the end of the year.
Master Your Chosen Tools
Before diving into live evaluations, take the time to thoroughly understand your trading tools and indicators. Avoid experimenting with new features or setups during critical trading periods - stick to what you know works.
Prepare Backup Procedures
Have a contingency plan in place for technical issues. This could include access to an alternative charting platform, keeping your broker’s contact information handy, and knowing how to manually close trades if needed.
Conclusion
Achieving success in prop trading depends heavily on making informed, data-driven decisions and sticking to consistent risk management practices. The tools discussed in this guide offer a strong starting point for monitoring performance, spotting patterns, and sharpening strategies to improve profitability.
Among these tools, TradersYard stands out by blending analytics with funding opportunities. With simulated funding up to $500,000 and profit splits as high as 95%, the platform provides U.S.-based traders with the resources to focus on disciplined, data-backed strategies. Its structured evaluation process fosters the analytical habits that set successful funded traders apart.
Choosing the right mix of tools is crucial - overloading your setup can actually hurt your performance. Whether you prefer TradingView for advanced charting, TradeZella for detailed journaling, or even a custom spreadsheet, simplicity and consistency will always outperform complexity. Studies even show that traders who consistently review their analytics are up to 30% more likely to achieve and maintain funded status compared to those who skip performance tracking[1].
However, no tool - no matter how advanced - can compensate for a lack of discipline. Ignoring risk alerts, skipping trade entries, or overlooking data insights will render even the best platforms ineffective. Start with a core set of tools, master their use, and let the data guide your decisions. This disciplined approach is what gives traders the edge they need to thrive in prop trading.
With competitive challenge fees and generous profit splits becoming the norm, leveraging analytics has never been more important. Systematic performance tracking consistently delivers better results than relying on gut feelings, making it an indispensable part of a trader's journey to success.
FAQs
What should I consider when selecting the best prop trading analytics tool for my needs? +
Choosing the right prop trading analytics tool hinges on your trading objectives, style, and budget. Begin by pinpointing the features that matter most to you - whether that's performance tracking, risk management tools, or real-time analytics. A tool with a user-friendly interface and seamless integration with your trading platform can make a world of difference.
Take a close look at the pricing structure to ensure it aligns with your budget. Many tools offer free trials or demo versions, giving you a chance to test their functionality before making a commitment. Additionally, prioritize platforms with clear and transparent guidelines, especially if you're working with simulated funding. This clarity can simplify your trading process and help you stay focused on your goals.
What should you look for in a trade journaling tool for prop trading? +
When picking a trade journaling tool for prop trading, focus on features that can genuinely improve how you track performance and make decisions. Tools with detailed analytics - like profit and loss breakdowns, win rates, and risk metrics - are invaluable for assessing your strategies. Having access to customizable reports is another big plus, as it lets you align insights with your unique trading objectives.
Ease of use is key, so look for tools that are user-friendly and allow for seamless data imports from your broker or trading platform. This minimizes the hassle of manual entry and keeps your records accurate. If you trade on platforms like TradersYard, make sure the journaling tool is compatible to keep your workflow smooth and efficient.
Why is real-time risk management important in prop trading, and how do analytics tools support it? +
Real-time risk management is a critical aspect of prop trading, enabling traders to make swift, informed decisions to safeguard their capital and boost profits. Financial markets can shift in an instant, and having immediate access to insights about positions, exposure, and overall performance can mean the difference between thriving and falling behind.
Analytics tools are indispensable in this process, offering real-time data on key metrics such as trade performance, risk exposure, and account balances. These tools help traders spot trends, refine strategies, and operate within set risk boundaries, ensuring they stay aligned with their trading objectives and platform guidelines. Features like automated reports and visual dashboards streamline the process, allowing traders to concentrate on execution while maintaining full control over their risk.